QTS Profile and QTS IPO: Data Center REIT To Be
Quality Realty Trust, Inc. (QTS) filed their Form S-11 Draft Registration Statement (DRS) with the SEC on May 31, 2013, and final prospectus on October 10, 2013. On Wednesday October 9, 2013 the QTS IPO was at $21.00 per share. QTS has been operating as a REIT in the past and plans to maintain that tax status moving forward.
QTS Overview
QTS was founded in 2003 by Chad Williams, its current Chairman and CEO, with a single 33,000 square foot facility. Their portfolio now exceeds 3.5 million gross square feet with over 700,000 square feet of currently available data center floor space at 10 U.S. data center locations. The Atlanta area (Atlanta-Metro and Atlanta-Suwanee) and Santa Clara data centers accounted for approximately 64% and 12%, respectively, of their annualized rent as of June 30, 2013.
QTS refers to their product set as the “3Csâ€, consisting of Custom Data Center, Colocation and Cloud and Managed Services. The Custom Data Center, or C1, product features large, private spaces that house customer-critical IT infrastructure, equivalent to wholesale colocation. The Colocation, or C2, product features data center space in the form of leased cages, cabinets or suites, which typically provide smaller amounts of space than the C1 product, essentially retail colocation. The Cloud and Managed Services, or C3, products are a portfolio of secure, regulatory-compliant and scalable IT infrastructure and services designed to support varied business applications and requirements. The Cloud product offers a private cloud solution (on-demand access to a pool of servers) through QTS Cloud Pods, which are installed in their larger data centers adjacent to the interconnect hubs in each facility. Managed Services are support services that include the management of networks, security, operating systems and data back-up, as well as applications monitoring and testing.
Lease Distribution by Product Type
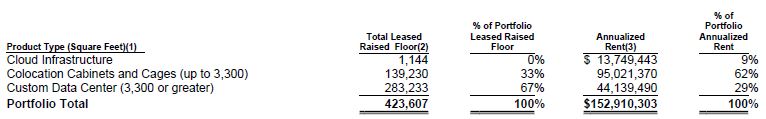
Note: Lease distribution footnotes available in Form S-11, page 129. www.sec.gov
The previous chart reflects product distribution by square feet of consumed space. Based on MRR (monthly recurring revenue) the C1, C2 and C3 products represented approximately 38%, 51% and 11%, respectively as of June 30, 2013.
QTS owns approximately 92% of the gross square footage of their properties. As an owner, QTS can efficiently utilize the facilities and make necessary adjustments based on customer demand, including expansions without needing to obtain landlord consent. Additionally they can realize returns from investment in their infrastructure without the risk that these improvements will be lost upon a lease termination or expiration. Finally, owning data centers allows QTS to enter into customer leases in the most profitable manner, without having to line up the lease term with the term of the underlying facility lease.
During the past three years, approximately 82% of new customers were identified and acquired solely by QTS’s in-house sales force.
Customer Mix
According to an August 5, 2013 press release, QTS added 80 new customers to their roster between January and June 2013. Overall their customer roster includes 870 companies. Fortune 1000 and equivalently sized private and/or foreign companies accounted for approximately 57% of their MRR.
Customer Distribution By Industry As Of June 30, 2013.
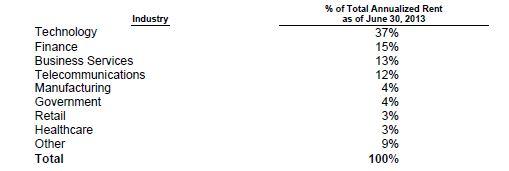
As of June 30, 2013, only three QTS customers individually accounted for more than 3% of their annualized rent, with no single customer accounting for more than 8% of annualized rent. Approximately 39% of their revenue was attributable to customers who use more than one of the 3Cs products.
QTS Revenue Profile ($ in millions)
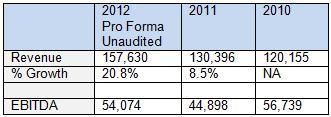
For the six months ending June 30, 3013, Pro Forma Unaudited revenue was $84.4 million, an increase of $13.1 million, or 18.4%, compared to $71.3 million for the corresponding period in 2012.
QTS Profile 6/30/2013

QTS Expansion Opportunities
Total property portfolio includes 3.8 million gross square feet, of which 92% is owned. Today there are 714,000 operating NRSF (net rentable square feet) of data center space. There is another 1.1 million NRSF of data center space in their redevelopment pipeline, which totals to 1.8 million NRSF at full build out.
QTS’s expansion potential does not require acquiring any new facilities or new construction, each of which can come with numerous incidental costs, regulatory and licensing requirements, and various potential delays in development. Not only does this typically accelerate just in time deployment, it should help control deployment capital expense costs as well.
The short term deployment schedule includes 205,000 NRSF scheduled to open by June 30, 2014, and another 107,000 scheduled to open by June 30, 2016.
QTS’s current gross square feet according to their S-11 filing is 3,779,519 gross square feet. The following chart follows their portfolio growth as published by QTS.
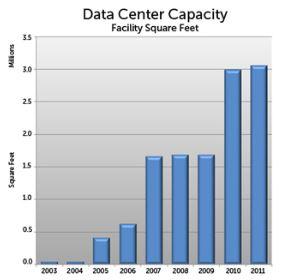 Source: www.qualitytech.com/about-us/history
Stay Tuned
QTS will be interesting to watch in the future. Their customer profile is similar to CyrusOne, with both competitors heavily focused on Fortune 1000 equivalent tenants. What makes this an interesting market is the challenge getting into it and longer sales cycle, but the payback is typically strong growth from those clients in the future.
This report is for informational purposes only and should not be construed as investment advice. Seek an appropriate professional for investment advice. For questions about this report contact Alan Howard at ahoward (at) wiredre.com or 602-885-5311.