For the last couple years I’ve used the “Big 6” to include DLR, EQIX, COR, DFT, CONE and QTS. How convenient that when DLR swallowed DFT, the Switch (SWCH) IPO came together. I can still say Big 6. While there are many other public companies that sell colocation, these six are the most pure-play data center and colocation providers.
Some of the basic operating metric disclosures for the Big 6 provide the broader market of private data center owners insight and perspective in an otherwise very secretive market. It’s always interesting to get a new SEC S-1 filing (Registration Statement for IPO), in this case Switch, Inc.
Switch, Inc. is a well-known U.S. provider founded in 2000 with some unique data center design/architecture characteristics. If you get a chance to tour, do it. The tour is interesting from a technology standpoint, but also a lesson in sales and marketing.
Switch operates three data center campuses in the U.S. The Core Campus in Las Vegas has been in operation for about 10 years and is over 2 million square feet of data center space with up to 315 MW of power. The Pyramid Campus in Grand Rapids and The Citadel Campus near Reno opened in June 2016 and November 2016. Reno was a greenfield and Grand Rapids a retrofit of the Steelcase Pyramid campus.
Switch also recently announced The Keep Campus in Atlanta which began development in June of 2017 and is targeted to open in 2018. Finally, Switch also has a 50% interest in SUPERNAP International with facilities in Italy and Thailand, which does not yet appear to generating revenue for Switch based on their S-1.
The following is a rundown of SEC disclosures and is not intended as an investment analysis. There are anomalies in the chart data which are described in the comments following each chart.
Big 6 Public Data Center Provider Revenue – Including Acquisitions
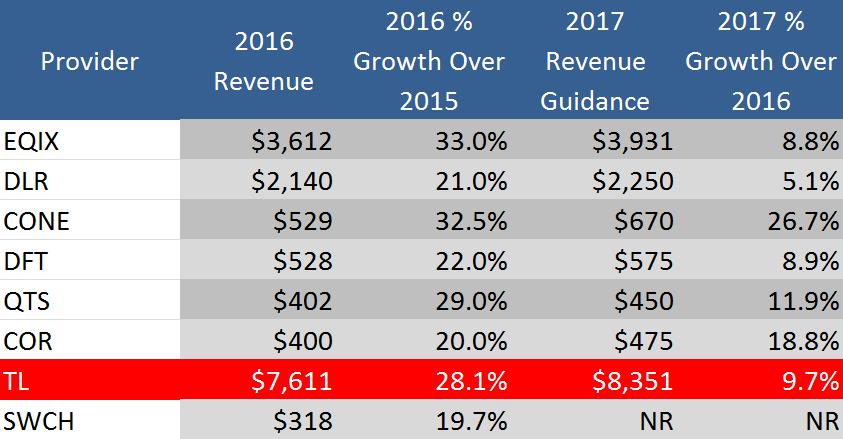
Note: CONE includes the integration of their Sentinel acquisition in 2017 guidance, which was not included in 2016 FYE revenue. Excluding Sentinel’s ~$50 mill revenue baked into 2017 guidance (prorated to 10 months), CONE’s growth number would be 18.9%. See additional explanations below. No other acquisition integrations were identified for the other Big 6 data center providers that were not included in 2016 FYE data.
Note: Data from FYE 2016 except as noted below. NR = not reported.
These numbers are simply SEC reported revenue and DO NOT represent organic growth, but rather the difference in revenue from FYE 2015 to 2016 including acquisition integrations. The growth rate, therefore, is really a perspective on the overall size of these companies in aggregate and NOT a representation of organic growth rate in the industry.
The last column, 2017 % Growth Over 2016, is generally a better benchmark to organic growth, as it includes 2016 integrations already reported in FYE 2016 data (except the CONE note above). These numbers are based on the 2017 revenue guidance midpoint, which is typically fairly accurate. Switch reported 19.7% 2016 growth over 2015, but also disclosed an average revenue CAGR of 24% from 2013 to 2016 in their S-1.
For the six months ending June 2017, 95.8% of Switch’s revenue was generated by Las Vegas operations, and comprised 99.4% of our revenue during the year ended December 31, 2016. Based on revenue for six months ending June 2017 of $181.2 million, this would indicate Reno and Grand Rapids generated $7.6 million in revenue during H1 2017. The S-1 disclosed “Revenue derived from customers outside the United States were less than 1% of revenue for each period presented.”
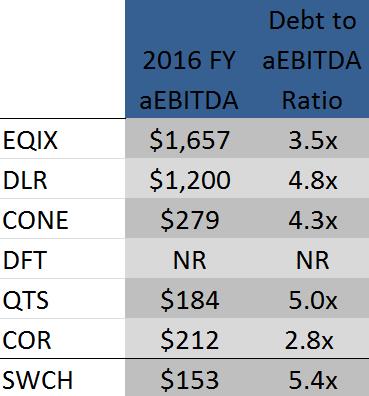
Note: Data from FYE 2016 except as noted below. NR = not reported. For CONE, their Sentinel integration will increase their ratio to 4.7x.
Technically the switch number is based on 2016 FYE aEBITDA, but currently reported debt in their S-1 is as of the end of Q2 2017. For the six months ended June 30, 2016 and 2017, Switch generated aEBITDA of $77.6 million and $93.9 million. If you’re interested in the debt ratio keep an eye open for future disclosures from Switch.
1.4% Three Year Average Churn

Note: Data from FYE 2016 except as noted below. NR = not reported.
The S-1 disclosed contracts with Switch customers “generally have terms of three to five years. Non-recurring installation fees, although generally paid in a lump sum upon installation, are deferred and recognized ratably over the expected life of the installation, which was 89 months, 73 months and 73 months as of December 31, 2015 and 2016 and June 30, 2017, respectively.” Not confirmed, but suggests the average customer life is six years.
Switch’s three year average churn rate is lowest amongst peers at 1.4%. Although YoY numbers would be preferable, it’s very competitive. The S-1 notes “Churn is defined as a reduction in recurring revenue attributed to customer terminations or non-renewal of expired contracts, as a percentage of revenue at the beginning of the period”, consistent with other retail data center provider disclosures.
Switch did not disclose NRSF. The chart above estimates NRSF at 50% of gross SF.
Aggregate utilization was not disclosed. However, as of June 30, 2017, the utilization rates at each campus, based on available cabinets, were approximately 83% at The Core Campus (Vegas), 15% at The Citadel Campus (Reno) and 15% at The Pyramid Campus (Grand Rapids).
Customer Profile
![]()
Switch’s clients include Amazon Web Services, eBay, Marvel, Shutterfly, FOX, Amgen, Lionsgate, Zappos, Intuit, DreamWorks, Intel, MGM, HP, State of Nevada, PayPal, Hulu, Machine Zone, Boeing, Warner Brothers, NASA, Verizon and many hundreds more. (Switch press release 6/15/17).
The ecosystem connects more than 800 customers, including over 100 cloud and managed services providers and 50 telecommunications providers.
Switch’s top 10 customers accounted for approximately 38.4% and 38.1% of revenue for the year ended December 31, 2016 and the six months ended June 30, 2017, respectively. For the years ended December 31, 2015 and 2016 and the six months ended June 30, 2016 and 2017, their largest customer, eBay, Inc., and its affiliates accounted for 14.1%, 13.3%, 12.7% and 9.6%, respectively, of their revenue.
In comparison, EQIX’s top 10 customers represent 17% of revenue, and their largest customer accounts for 2.7% of MRR. In contrast, DFT’s top 10 customers represent 87% of revenue, and their largest customer accounts for 25.4% of revenue (DFT reports it as % of annualized base rent). Obviously, very different business models.
Switch Customer Market Distribution
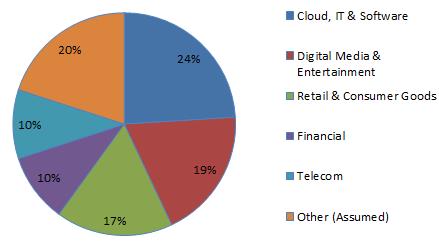
The S-1 reports client vertical market distribution includes approximately 24% in cloud, IT and software, 19% in digital media and entertainment, 17% in retail and consumer goods, 10% in financial and 10% in telecommunications. In the chart above we are assuming the remaining 20% is miscellaneous other vertical markets.
Additional Switch Fun Facts
While some of the following S-1 excerpts are a bit wordy, it’s important to be sure the full context is included so as to avoid misleading information.
Maintenance CAPEX: “Our maintenance capital expenditures were $8.6 million and $5.1 million for the years ended December 31, 2015 and 2016 and $3.9 million and $2.6 million for the six months ended June 30, 2016 and 2017, respectively.”
Sustainability: “We believe that while data runs the planet, it should not ruin the planet. We were the only company recognized by Greenpeace in its 2017 Clicking Clean report as having a 100% clean energy index. Our energy index was higher than every other technology company identified in the report, including Apple, Facebook, Google, Microsoft and Salesforce. Additionally, we were the only company in the report to receive an “A” grade in all five categories measured by Greenpeace, and our overall “A” grade Outperformed all of the other data center operators, including Equinix, which received a clean energy index of 20% and a “B” grade, Digital Realty Trust, which received a clean energy index of 21% and a “C” grade, and DuPont Fabros, which received a clean energy index of 7% and an “F” grade.”
S&M Spend: “Sales and marketing spend for the year ended December 31, 2016 was 3.7% of revenue. We believe this is among the lowest in the industry.”
Sales Team: “As of September 1, 2017, our colocation sales team consisted of 10 employees. No member of our sales team receives commissions, which fosters a team environment and allows our representatives to offer the customer the solution they need without artificial sales pressure. We believe that the strength of our product and market reputation are the single biggest reasons for increased sales activity. We generally will take on incremental sales headcount only when expanding into new geographies.”
Marketing Team: “To support our sales efforts and to promote our brand proactively, we have a branding team and a marketing team. As of September 1, 2017, our branding and marketing team consisted of 16 employees. Our marketing strategies include active public relations and ongoing customer communications programs. We also regularly measure customer satisfaction levels and host key customer forums to identify and address customer needs. We believe our brand is one of our most valuable assets, and we strive to build recognition through our website, external blog and social media channels, by sponsoring or leading industry technical forums, by participating in internet industry standard-setting bodies and through advertising and online campaigns.”
Patent Litigation: “On August 7, 2017, the Company filed a lawsuit in the U.S. District Court for the Eastern District of Texas against Aligned Data Centers LLC (“Aligned”) and MTechnology Inc. The lawsuit alleges, among other things, that Aligned is infringing at least three of the Company’s patents and engaging in unlawful competitive activities. The Company is seeking an injunction to prevent the defendants from infringing the Company’s patents, as well as other remedies. On August 16, 2017, Aligned filed an answer to the complaint and a motion to dismiss the lawsuit. Among other things, Aligned alleges that the Company’s patents in question should be declared invalid, and countersued the Company for declaratory judgment of the non-infringement of certain of the Company’s patents; injunctive relief; and damages for alleged anti-competition practices involving Aligned’s trademarks in violation of the Lanham Act, tortious interference with Aligned’s business, and disparagement of Aligned’s business. The Company has retained outside counsel and is vigorously pursuing its rights and interests. The outcome of the Company’s legal proceedings is inherently unpredictable, subject to significant uncertainties, and could be material to the Company’s financial condition, results of operations, and cash flows for a particular period. For the pending matter described above, it is not possible to estimate the reasonably possible loss or range of loss.”
IPO Time to Market
If it seemed like the SWCH IPO happened quickly, but it wasn’t really. As a matter of curiosity, below is a chart with SWCH, QTS, and CONE IPO timelines.
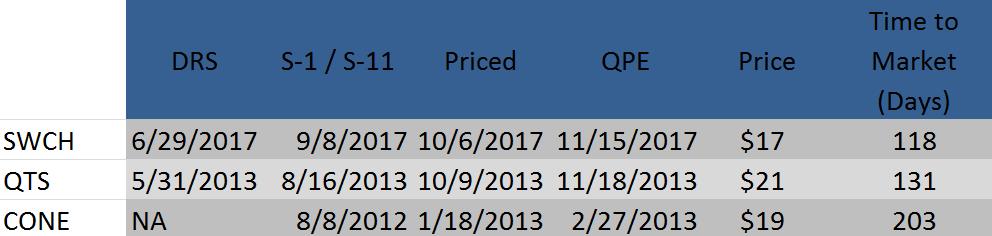
DRS (Draft Registration Statement) is filed confidentially and non-public. S1 or S-11 filings are public.
CONE and QTS are REITs and file an S-11, SWCH is not a REIT and filed an S-1.
QPE (Quiet Period Expiration).
Time to Market is the number of days from initial DRS or S-11 in the case of CONE.
Disclosure: The data provided herein has been derived from SEC filings based on my own interpretation of the data and is not intended to be advice of any kind. I am data center market analyst, not an investment analyst. I am not an investor in an of the data center stocks mentioned in this article. You may comment here or refer any questions to Alan Howard at “alan (at) acrhq (dot) com”.